TriceMate Mediation
Available now.
Hello and welcome!
With over 35 years collective experience working with leading mediation solutions at tier 1 telcos, we are on a mission to build the ultimate mediation platform that addresses all the gaps we’ve encountered over the years.
Our extensive background in production support and customizations for major US providers has allowed us to crystalize the ideal mediation platform, which is available now.
From our real-life experience, we understand which features are merely “bells and whistles”—impressive during a marketing demo but either marginally implemented or seldom used in actual operation. Conversely, we prioritize the features that other mediation vendors overlook, those that significantly enhance daily operations.
What is mediation?
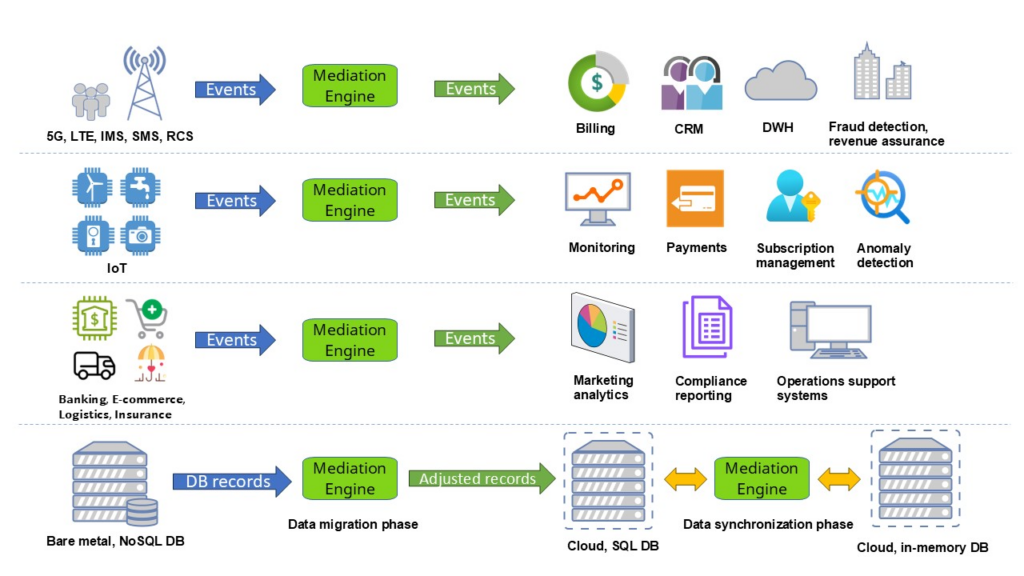
Event mediation is like a translator for telecom data. It collects data from various systems (such as mobile network elements), organizes it, and ensures it is in the correct format for analysis, billing, or revenue assurance. This process helps telecom companies track usage accurately and improve their services. This process is continuous, handling large volumes of data – often up to millions of usage records per second.
Another common use case is data transformation during data migration. Let’s assume you want to migrate data from Database A to Database B. A and B could represent SQL and NoSQL databases, or one could be an in-memory database with a sophisticated CLI – feel free to imagine any exotic set of source and destination.
During the data migration, you might want to transform some values, whether it’s simple normalization, cleanup, or even replacing values based on specific reference lookups. This may not seem too challenging when migrating a few thousand records, but what if you want to migrate 100 million or even 100 billion records? This is where event mediation comes into play.
Here are the key properties we prioritize and focus on:
Reliability
In an ideal world, servers would run forever, the network would never disconnect, and disks would never break. However, we live in the real world where such things do happen.
Older mediation systems we used before assumed they would run in an ideal world, and if something unpredictable happened, they did not provide automated recovery mechanisms for most scenarios or even clear instructions on how to handle them manually. That’s why we decided to build our system with real assumptions based on our real experiences, where crashes are not only possible but expected periodically.
We are seasoned veterans when it comes to crashes. Having dealt with countless crashes caused by various infrastructure issues, we’ve learned that recovery often requires manual intervention to clean up temporary data, restore broken parts, and eliminate duplicates. This process can take days, and even then, there’s no guarantee of complete recovery.
That’s why our primary focus in designing all services is automatic post-crash recovery with zero manual intervention. During critical state transformations, we meticulously consider potential crash scenarios and implement the necessary redundancies and recovery mechanisms to revive the data flow in a trice.
We now embrace crashes and rigorously test the reliability of our services by intentionally killing pods daily.
Say goodbye to the fear of crashes!
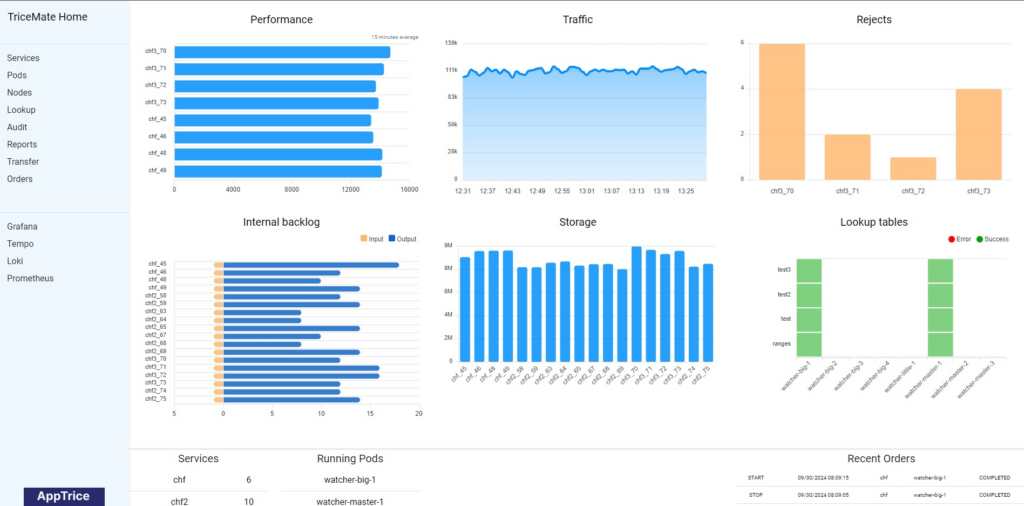
Performance
If you are using one of the legacy mediation systems, you probably observe modest performance, and your platform requires a surprisingly large amount of hardware. It’s understandable if you feel something is amiss – it should be faster, and the costs should be lower. And you’re correct!
With our performance-focused approach, we achieve significantly better performance using just a single CPU core compared to other mediation systems which were running on many dozens of cores. Imagine the potential with a modern 48-core setup. Prepare to significantly reduce your hardware requirements and associated costs. (Or, as we like to say, get ready to decommission your office heating system – you won’t need it soon!)
Considering this, we can reduce dozens of your data processing servers to just a couple of servers. The changes in your Cloud provider bill will surprise you too! Sounds like magic? Invite us for a Proof of Concept (POC) and let us demonstrate it to you.
Right Design Approach
It’s become trendy to implement the CDR processing flow using a distributed set of independently running processes that communicate via network, disk, or messaging queue. However, this inter-communication often becomes the primary bottleneck, adding unnecessary complexity and fragility.
Having operated our services in this manner for years, we’ve identified which components should use the benefits of both monoliths and microservices. We employ an approach that’s gaining traction: the modular monolith – modulith.
Our modules are developed with full isolation, clear boundaries, and interfaces. They can be easily combined into services that share similar processing steps: collection, decoding, business logic, encoding, and distribution—almost like LEGO bricks.
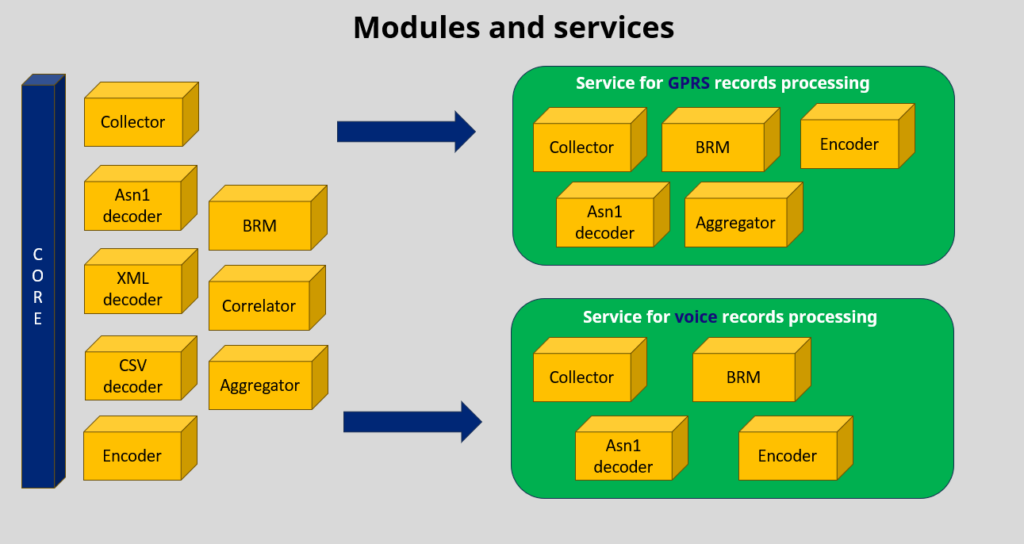
Modules are linked together at the final build stage, providing optimal performance and transaction guarantees of the monolith and all the benefits of microservices: single responsibility, maintainability, independent development and testing, and more. This approach allows different team members to work on separate modules simultaneously without affecting each other.
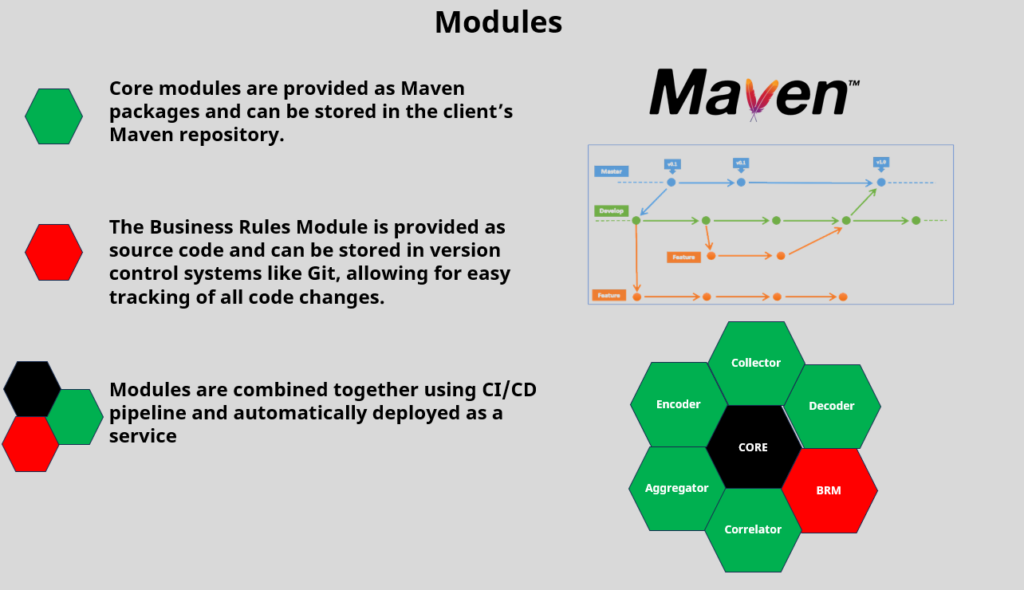
We use traditional microservices where it makes sense, meticulously choosing when they are fit.
Say goodbye to circuit breakers, intermediate disk buffer overflows (and related delays and data loss), partially committed transactions, and the team overhead of restarting failed microservices (because automated restarts aren’t perfect yet, are they?).
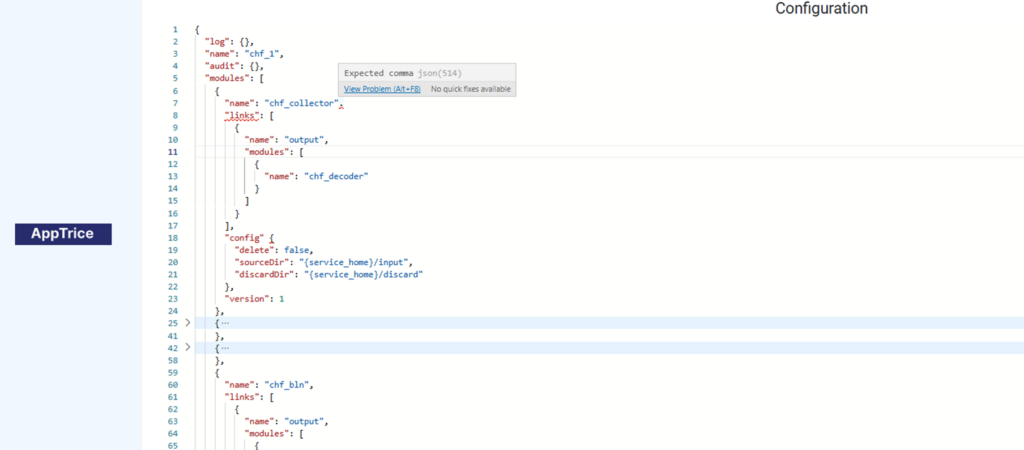
Convenient configuration editor in the UI
Our flexible configuration editor in the UI supports VS-like features, typos and mistakes will be highlighted
Hot Reconfiguration and Scheduled Auto-Configuration
Our services are designed to reconfigure themselves based on your new configuration schema without needing a restart.
Additionally, you can specify the exact date and time for the new configuration to be applied, allowing you to enjoy your sleep during the 1AM-3AM maintenance window while our systems handle the updates.
Reprocessing of selected records
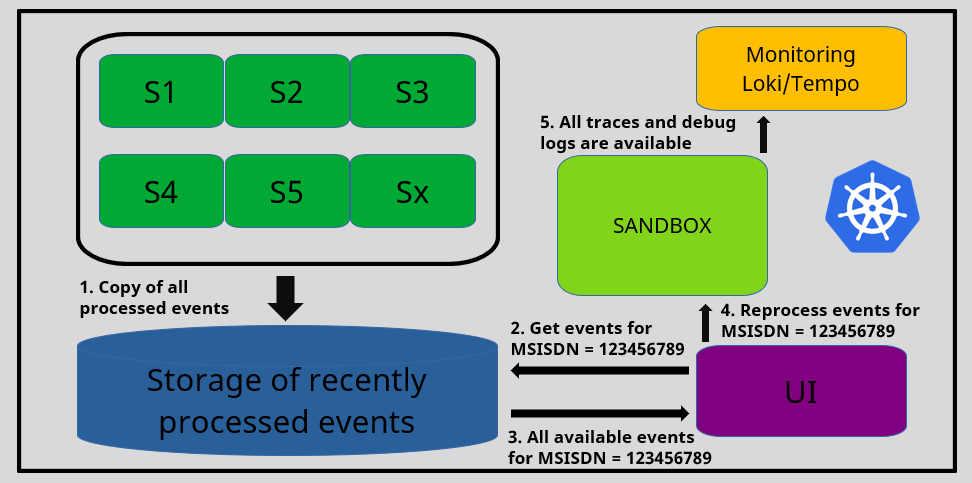
Whenever you need to perform deep analysis based on your operational requirements, you can quickly retrieve recently processed records for a specific MSISDN and reprocess them with full debug mode and trace collection enabled.
This operation can be done in the UI with just a few clicks and is completely harmless to the production environment, as the reprocessing occurs in an isolated sandbox.
Recurring Self Testing in Production
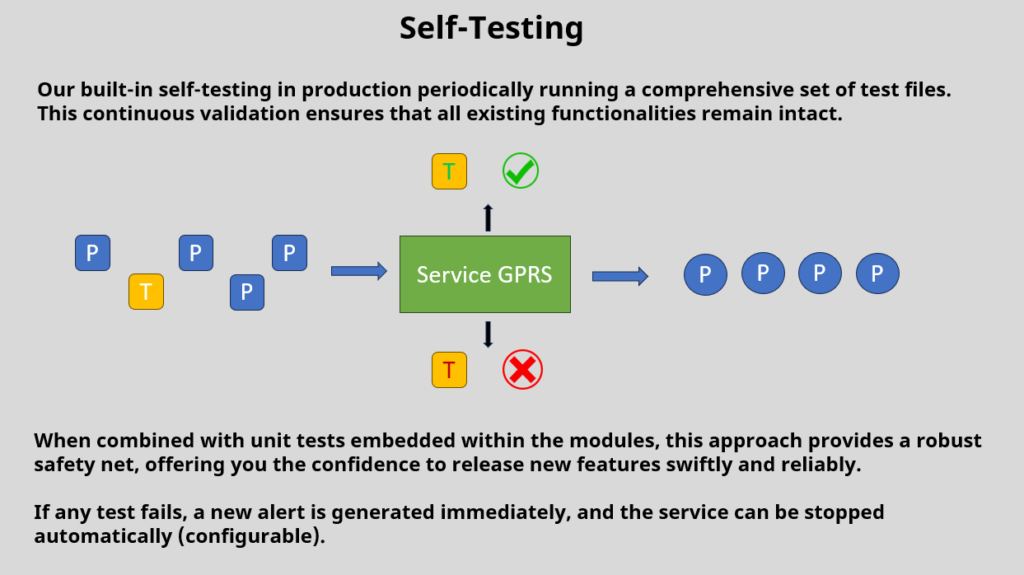
How often have you deployed a new feature, only to discover days—or even months—later that you’ve inadvertently disrupted some legacy functionality? Moreover, not all issues stem from your changes alone.
Your services rely on external APIs, databases, and other data sources. Your business logic is crafted to work with specific responses from these external entities. Any unforeseen changes to this external data, often outside your control, can lead to subtle and undetected issues in your system.
Our built-in self-testing in production mitigates these risks by periodically running a comprehensive set of test files. This continuous validation ensures that all existing functionalities remain intact. When combined with unit tests embedded within the modules, this approach provides a robust safety net, offering you the confidence to release new features swiftly and reliably.
ML-powered traffic analysis
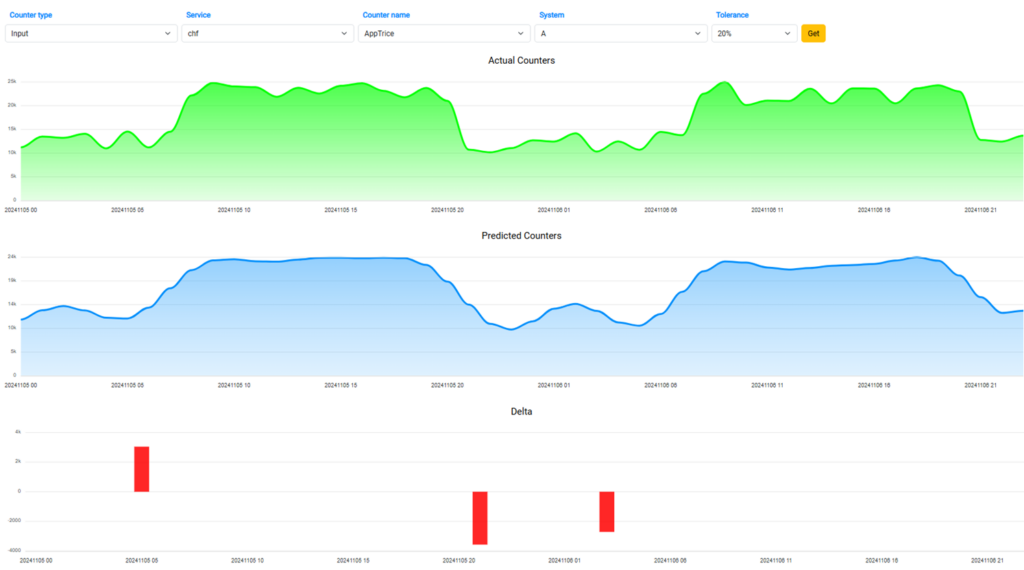
We are extensively using AI for trend prediction and anomaly detection.
Rest assured that all unexpected changes in traffic will be uncovered, allowing you to take the necessary actions.
Cloud vs. On-Prem Dilemma
Dilemma? Not for us, and certainly not for you anymore! Our solution is designed from the ground up to support operations in both Kubernetes and Bare Metal (or VPS) environments.
Regardless of future trends, you can easily switch your deployment between the cloud and your own data centers without needing to change a single line of code. One simple switch is all it takes to stay trendy or within your budget allocation. Plus, you’ll be able to create a new pod and make it live directly from our web UI in a matter of seconds, thanks to our native integration with the Kubernetes API.
Observability and Traceability
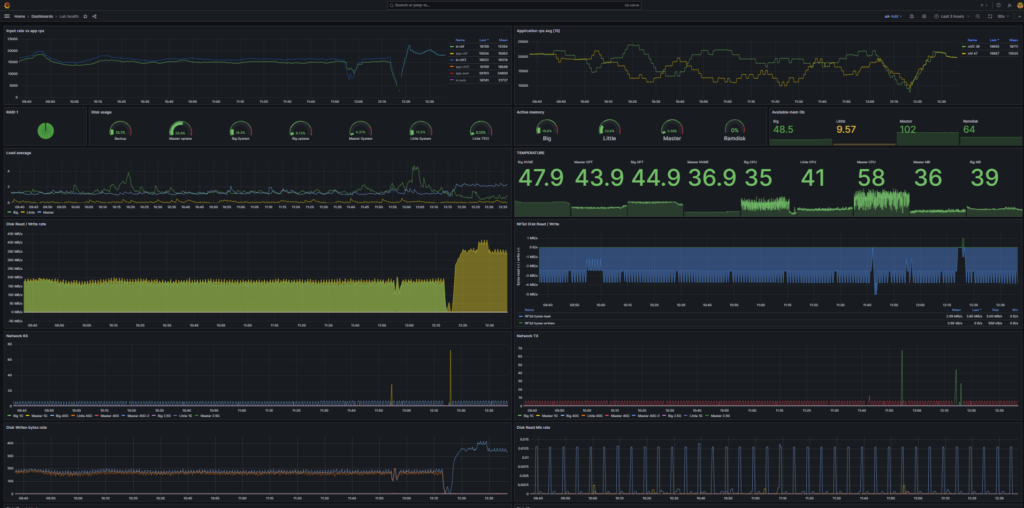
In recent years, using the Grafana stack (Grafana/Loki/Tempo) and Prometheus has become the standard. While legacy mediation solutions struggle to add support as an afterthought, we started development when these tools became the de facto standard. Our services are built from the ground up with OpenTelemetry support, featuring various isolated tracers to provide a complete X-ray of all your modules and their performance in real-time.
Want to see all interconnected modules in a service as a graph? You got it, with real-time statistics on RPS, error rates, and time spans.
We offer tracing for every file and every record — for any module in the service.
Now you can visualize how much time each step takes for each file and record, allowing your development/support team to optimize performance as needed or decide if it’s time to move a process to a separate service.
And yes, all your logs are in Loki, with the ability to query by service, date range, severity, and other filters natively provided by the best-in-class Grafana stack.
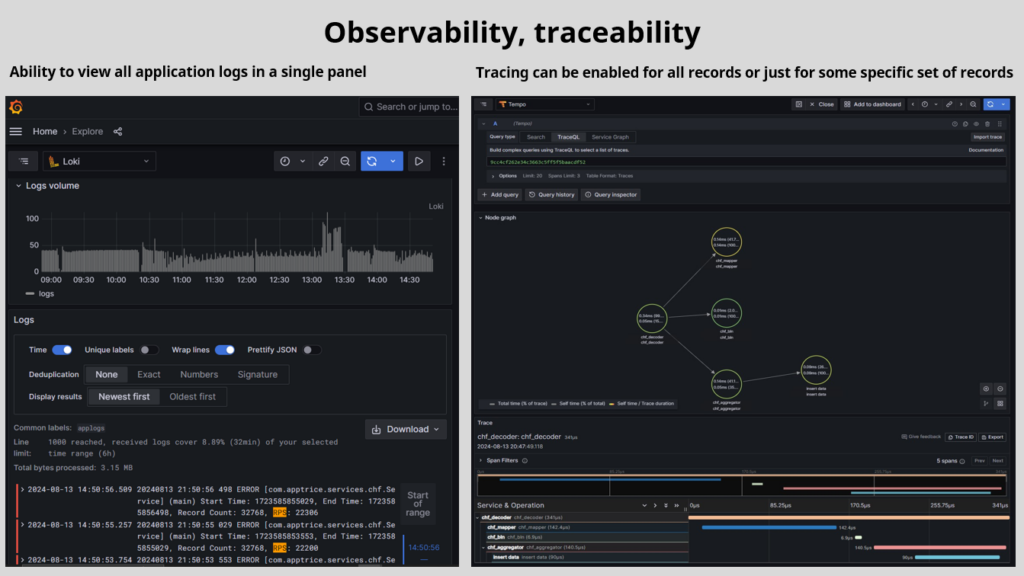
Say goodbye to searching individual servers for log files that may or may not contain the explanation of today’s application issue!
Statistics and Audit
Often underappreciated by developers, auditing becomes crucial in production. You need to trace the origin of a particular output record back to its input file, even if it was aggregated. You need to track which output files contain records from a specific input file, and measure the time taken to collect or distribute a file along with the transfer speed.
Our platform provides these capabilities and more. With custom counters stored in Prometheus or other storages, you can create charts in Grafana to monitor and detect anomalies. This comprehensive auditing is already integrated into our platform. Enjoy it!
File Collection and Distribution
Our renowned TricePorter, enhanced with enterprise-grade functionality, offers all the features you could want in a mediation platform for collecting and distributing files outside of the mediation servers. The comprehensive list of features is extensive, so we invite you to explore the dedicated details at the TricePorter page.
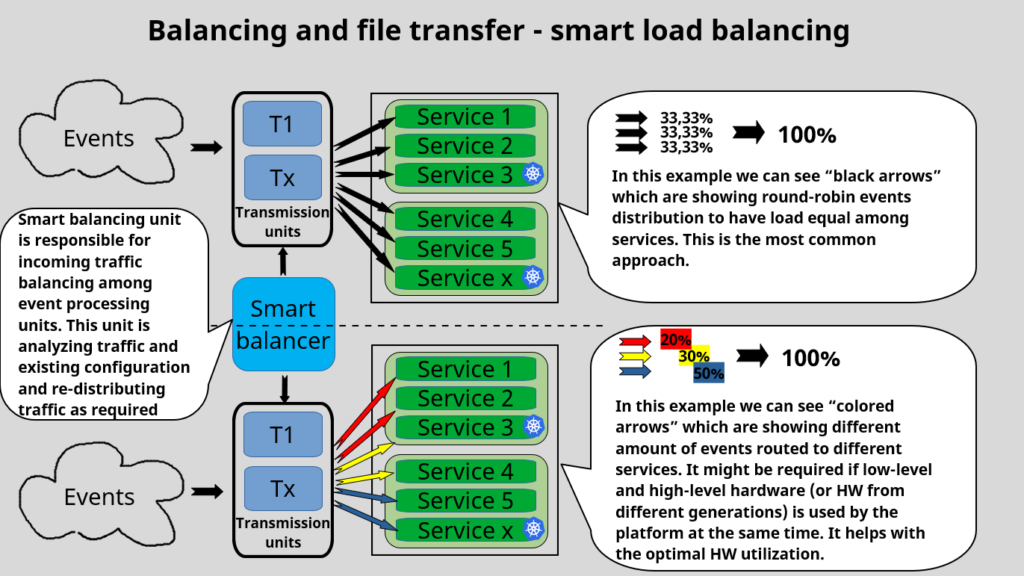
Automatic Load Balancing
Our intelligent automatic load balancer monitors and analyzes data collection patterns, seamlessly distributing traffic to less loaded servers or pods when necessary.
You can enable or disable this feature on a per-service type basis, depending on your data affinity needs.
Need More Features? We Have Them.
Our platform offers a range of additional features to meet your needs, including file and record-level duplication checks, compression and decompression of input and output files, and archival into daily subdirectories, among many others.
List of the available Services and Modules
- Cloud Native Management Subsystem
- Bare Metal Management Subsystem
- Web UI
- Audit Subsystem
- Lookup Subsystem
- Collector and Distributor, powered by TricePorter
- ASN1 Decoder and Encoder
- CSV Decoder and Encoder
- Business Logic Module
- Binary Encoder
- Aggregator
- Correlator
- XML Decoder and Encoder
We welcome you to try TriceMate – our ultimate mediation solution. Contact us for a free and no-obligation POC!